1QFY2020 Result Update | Dairy Products
August 7, 2019
Parag Milk Foods
BUY
CMP
`190
Performance Update
Target Price
`304
Y/E March (` cr)
1QFY20
1QFY19
% yoy
4QFY19
% qoq
Investment Period
12 Months
Net sales
630
549
14.6
672
(6.3)
EBITDA
57
60
(4.6)
44
30.1
Stock Info
EBITDA margin (%)
9.0
10.9
(182bp)
6.5
252bp
Sector
Dairy Products
Adjusted PAT
28
28
(2.7)
31
(12.1)
Market Cap (` cr)
1,569
Net Debt (` cr)
202
For 1QFY2019, Parag Milk Foods (PMFL) posted healthy numbers on top-line
front, however bottom-line was below expectation. The company’s revenue grew
Beta
1.1
by ~15% yoy, while the operating margins contracted by 182bps yoy. On the
52 Week High / Low
344/185
bottom-line front, PMFL reported de-growth of ~3% yoy to `28cr on the back of
Avg. Daily Volume
26,047
poor operating performance.
Healthy volume growth drives top-line: PMFL’s top-line grew by ~15% yoy due to
Face Value (`)
10
strong growth in value added products like cheese, ghee, paneer, etc., which grew
BSE Sensex
36,814
by ~16% yoy, whereas liquid milk registered growth of 7% yoy and skimmed milk
Nifty
10,885
grew by ~21% yoy.
Reuters
Code
PAMF.NS
Increase in milk procurement prices impacted the overall operating margin: On
the operating front, the company reported margin contraction of 182bps yoy at
Bloomberg Code
PARAG.IN
9.0%, which is mainly due to an increase in milk procurement prices (Due to
drought effect of last year and delayed monsoons, feed availability was severely
constrained leading to stress at farmer level. Therefore, raw milk prices paid to
Shareholding Pattern (%)
farmers increased sequentially during the quarter). On the bottom-line front, PMFL
Promoters
46.0
reported de-growth of
~3% yoy to `28cr on the back of poor operating
MF / Banks / Indian Fls
6.7
performance. We have already passed on the raw milk price increase by
combination of increased consumer prices and reduced trade discounts. The full
FII / NRIs / OCBs
17.4
effect of this correction will come from Q2 FY20.
Indian Public / Others
30.0
Outlook and Valuation: Parag Milk Foods is anticipated to post strong growth in
value added products on the back of its diversified product basket, strong brands
and wide distribution network. Further, PMFL would benefit from a shift in mix in
Abs. (%)
3m 1yr 3yr
favor of the organized market for dairy products. At the current market price, the
Sensex
(4.2)
(1.9)
31.2
company trades at a P/E of 9.4x its FY2021E EPS. Thus, we maintain our Buy
recommendation on PMFL with Target Price of `304.
PARAG
(14.8)
(14.8)
-
Key Financials
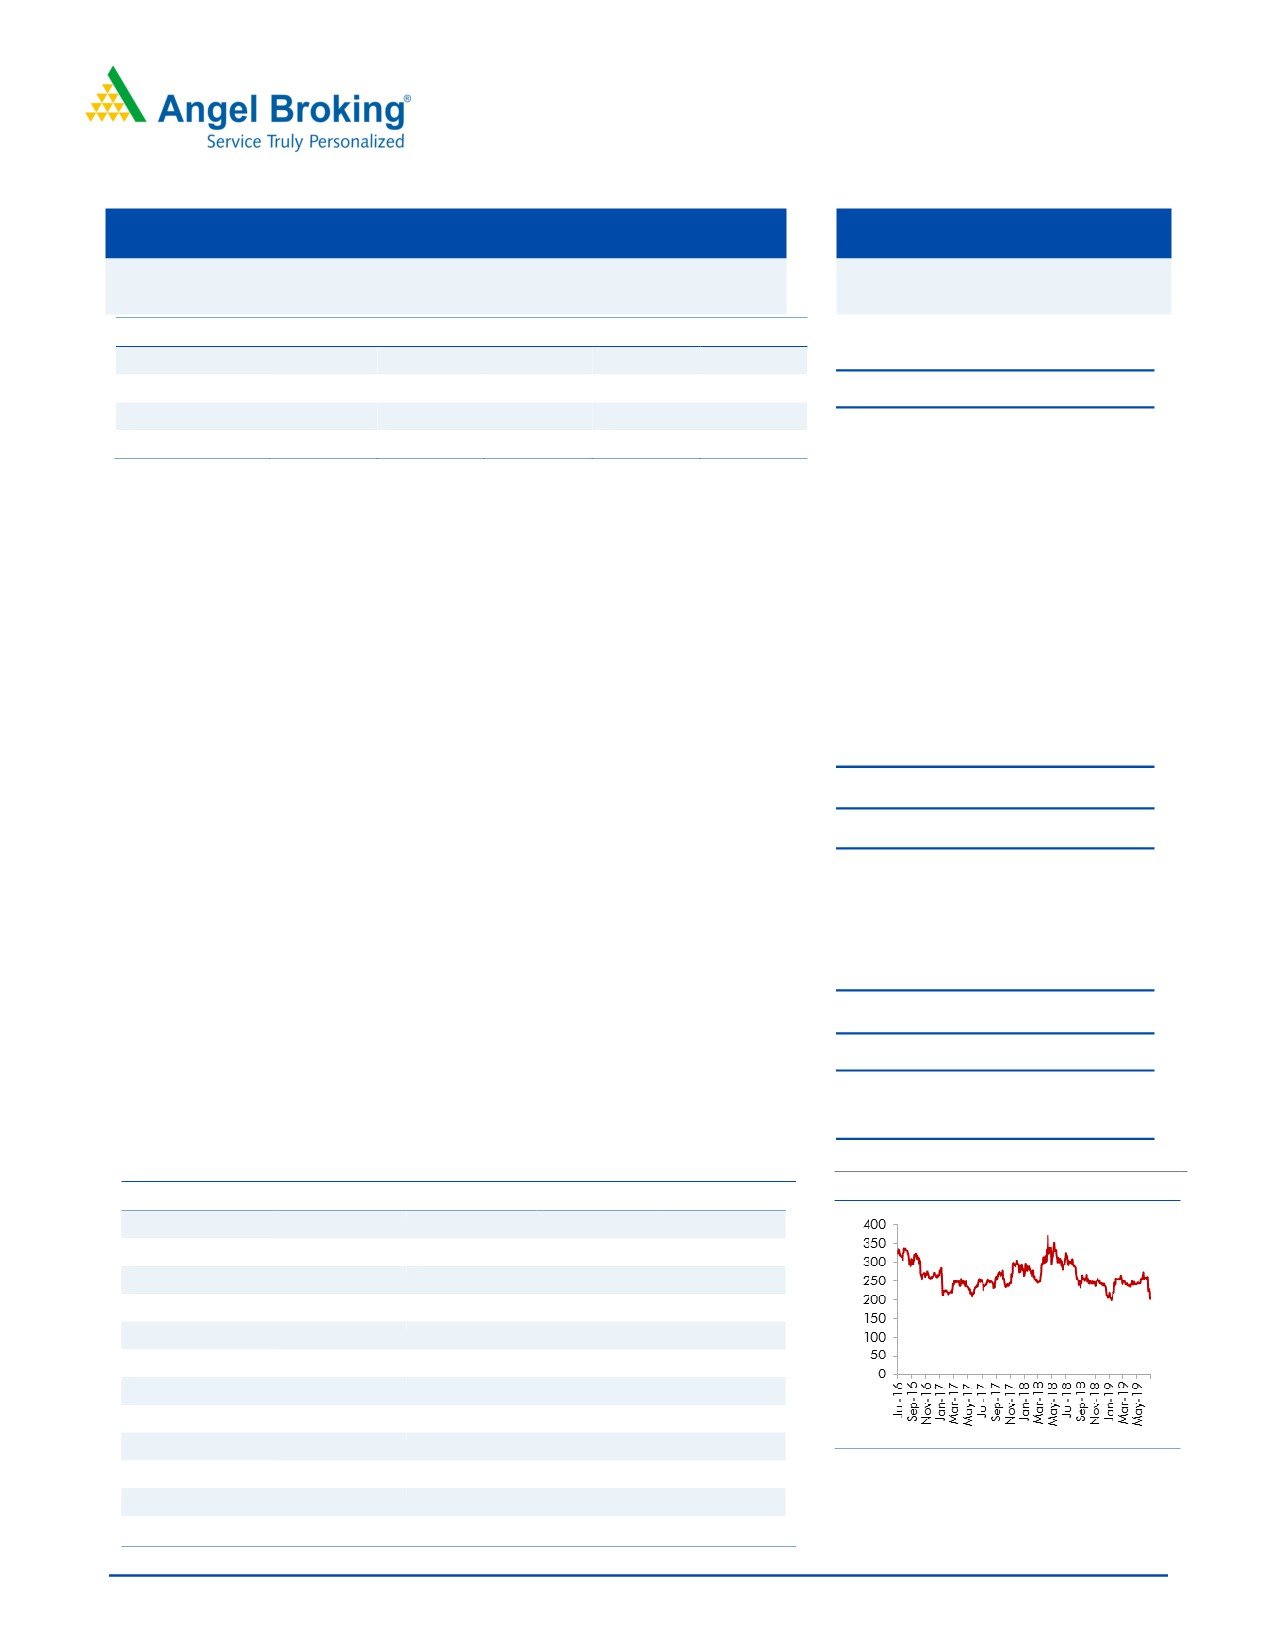
Price Chart
Y/E March (` cr)
FY2018
FY2019
FY2020E
FY2021E
Net Sales
1,986
2,396
2,763
3,177
% chg
14.8
20.6
15.3
15.0
Net Profit
89.2
120.7
144.7
170.6
% chg
(69.6)
35.4
19.9
17.9
OPM (%)
10.0
9.3
10.5
10.5
EPS (Rs)
10.6
14.3
17.2
20.3
P/E (x)
17.9
13.2
11.0
9.4
P/BV (x)
2.9
2.5
2.1
1.8
RoE (%)
12.4
14.4
14.8
14.8
Source: Company, Angel Research
RoCE (%)
14.9
16.5
19.6
20.0
EV/Sales (x)
Amarjeet S Maurya
0.9
0.8
0.6
0.5
022 - 3935 7800 Ext: 6831
EV/EBITDA (x)
9.1
8.1
6.1
5.1
Source: Company, Angel Research
Please refer to important disclosures at the end of this report
1
Parag Milk Foods |1QFY2020 Result Update
Exhibit 1: 1QFY2020 Performance
Y/E March (` cr)
1QFY20
1QFY19
% yoy
4QFY19
% qoq
FY2019
FY2018
% chg
Net Sales
630
549
14.6
672
(6.3)
2396
1955
22.6
Consumption of RM
461
383
20.6
473
(2.5)
1,657
1,368
21.2
(% of Sales)
73.3
69.6
70.4
69.2
70.0
Staff Costs
27
20
30.8
26
3.2
95.0
73.5
29.2
(% of Sales)
4.2
3.7
3.9
4.0
3.8
Other Expenses
85
87
(2.1)
129
(34.4)
419.8
319.8
31.3
(% of Sales)
13.5
15.8
19.3
17.5
16.4
Total Expenditure
573
490
17.0
628
(8.8)
2,172
1,761
23.3
Operating Profit
57
60
(4.6)
44
30.1
224
193
15.6
OPM
9.0
10.9
6.5
9.3
9.9
Interest
9
10
(8.2)
8
19.3
35.8
35.7
0.2
Depreciation
13
14
(1.9)
9
41.1
50
51
(0.8)
Other Income
3
2
57.9
6
(55.7)
10
12
(14.5)
PBT (excl. Ext Items)
37
38
(1.7)
33
12.9
148
119
24.2
Ext (Income)/Expense
-
-
-
-
-
PBT (incl. Ext Items)
37
38
(1.7)
33
12.9
148
119
24.2
(% of Sales)
5.9
6.9
4.9
6.2
6.1
Provision for Taxation
10
9
1.2
2
516.1
27.1
30.1
(10.0)
(% of PBT)
25.8
25.0
4.7
18.3
25.3
Reported PAT
28
28
(2.7)
31
(12.1)
120.71
89
35.8
PATM
4.4
5.1
4.7
5.0
4.5
Minority Interest After NP
Reported PAT
28
28
(2.7)
31
(12.1)
121
89
35.8
Extra-ordinary Items
Adj PAT
28
28
(2.7)
31.3
(12.1)
121
89
35.8
Equity shares (cr)
8
8
8
8
8
FDEPS (Rs)
3.3
3.4
(2.7)
3.7
(12.1)
14.4
10.6
35.8
Source: Company, Angel Research
August 7, 2019
2
Parag Milk Foods |1QFY2020 Result Update
Outlook and Valuation
Parag Milk Foods is anticipated to post strong growth in value added products on
the back of its diversified product basket, strong brands and wide distribution
network. Further, PMFL would benefit from a shift in mix in favor of the organized
market for dairy products. At the current market price, the company trades at a P/E
of 9.4x its FY2021E EPS. Thus, we maintain our Buy recommendation on PMFL
with Target Price of `304.
Risks to our estimates
1) Inability to procure sufficient good quality raw milk at commercially viable
prices.
2) Increase in competitive intensity.
August 7, 2019
3
Parag Milk Foods |1QFY2020 Result Update
Profit & Loss Statement
Y/E March ( ` cr)
FY2018
FY2019
FY2020E
FY2021E
Total operating income
1,986
2,396
2,763
3,177
% chg
14.8
20.6
15.3
15.0
Total Expenditure
1,788
2,172
2,472
2,843
Raw Material
1,303
1,657
1,934
2,224
Personnel
85
95
110
126
Others Expenses
400
420
428
492
EBITDA
198
224
291
335
% chg
(42.8)
12.9
30.2
15.0
(% of Net Sales)
10.0
9.3
10.5
10.5
Depreciation& Amortisation
52
50
57
61
EBIT
146
173
234
274
% chg
(50.8)
18.5
35.3
16.7
(% of Net Sales)
7.4
7.2
8.5
8.6
Interest & other Charges
36
36
38
40
Other Income
9
10
10
10
(% of PBT)
7.9
6.9
5.0
4.2
Share in profit of Associates
-
-
-
-
Recurring PBT
119
148
207
244
% chg
(56.6)
23.9
39.9
17.9
Tax
30
27
62
73
(% of PBT)
25.3
18.3
30.0
30.0
PAT (reported)
89
121
145
171
Extraordinary Items
-
-
-
-
Less: Minority interest (MI)
PAT after MI (reported)
89
121
145
171
ADJ. PAT
89
121
145
171
% chg
(69.6)
35.4
19.9
17.9
(% of Net Sales)
4.5
5.0
5.2
5.4
Fully Diluted EPS (`)
10.6
14.3
17.2
20.3
% chg
148.1
35.4
19.9
17.9
August 7, 2019
4
Parag Milk Foods |1QFY2020 Result Update
Consolidated Balance Sheet
Y/E March (` cr)
FY2018
FY2019
FY2020E
FY2021E
SOURCES OF FUNDS
Equity Share Capital
84
84
84
84
Reserves& Surplus
633
753
897
1,066
Shareholders Funds
717
837
981
1,150
Equity Share Warrants
-
-
-
-
Total Loans
264
214
214
214
Deferred Tax Liability
-
-
-
-
Other liabilties
9.4
9.4
9.4
9.4
Total Liabilities
921
1,118
1,264
1,435
APPLICATION OF FUNDS
Gross Block
645
705
765
825
Less: Acc. Depreciation
278
328
385
446
Net Block
367
377
380
379
Capital Work-in-Progress
20
20
20
20
Investments
5
-
-
-
Current Assets
905
938
1,115
1,323
Inventories
438
459
530
609
Sundry Debtors
252
282
325
374
Cash
50
12
47
95
Loans & Advances
166
185
213
245
Other Assets
-
-
-
-
Current liabilities
396
242
282
325
Net Current Assets
509
696
833
999
Deferred Tax Asset
8
8
10
11
Mis. Exp. not written off
12
16
20
26
Total Assets
921
1,118
1,264
1,435
August 7, 2019
5
Parag Milk Foods |1QFY2020 Result Update
Exhibit 2:
Y/E March (` cr)
FY2018
FY2019
FY2020E FY2021E
Profit before tax
119
148
207
244
Depreciation
52
50
57
61
Change in Working Capital
(64)
(225)
(102)
(118)
Interest / Dividend (Net)
36
36
38
40
Direct taxes paid
(30)
(27)
(62)
(73)
Others
0
0
0
0
Cash Flow from Operations
113
(18)
138
154
(Inc.)/ Dec. in Fixed Assets
(60)
(60)
(60)
(60)
(Inc.)/ Dec. in Investments
61
(4)
(5)
(6)
Cash Flow from Investing
1
(64)
(65)
(66)
Issue of Equity
0
0
0
0
Inc./(Dec.) in loans
1
(50)
0
0
Dividend Paid (Incl. Tax)
0
0
0
0
Interest / Dividend (Net)
(36)
(36)
(38)
(40)
Cash Flow from Financing
(35)
(85)
(38)
(40)
Inc./(Dec.) in Cash
78
(167)
35
48
Opening Cash balances
101
179
12
47
Closing Cash balances
179
12
47
95
Source: Company, Angel Research
August 7, 2019
6
Parag Milk Foods |1QFY2020 Result Update
Key Ratios
Y/E March
FY2018
FY2019
FY2020E
FY2021E
Valuation Ratio (x)
P/E (on FDEPS)
17.9
13.2
11.0
9.4
P/CEPS
14.9
14.9
12.3
10.4
P/BV
2.9
2.5
2.1
1.8
Dividend yield (%)
0.1
0.1
0.1
0.1
EV/Sales
0.9
0.8
0.6
0.5
EV/EBITDA
9.1
8.1
6.1
5.1
EV / Total Assets
2.0
1.6
1.4
1.2
Per Share Data (`)
EPS (Basic)
10.6
14.3
17.2
20.3
EPS (fully diluted)
10.6
14.3
17.2
20.3
Cash EPS
16.7
16.7
20.3
23.9
DPS
0.1
0.1
0.1
0.1
Book Value
85.2
99.5
116.6
136.8
Dupont Analysis
EBIT margin
7.4
7.2
8.5
8.6
Tax retention ratio
0.7
0.8
0.7
0.7
Asset turnover (x)
2.1
2.3
2.4
2.5
ROIC (Post-tax)
11.8
13.6
14.3
15.1
Cost of Debt (Post Tax)
0.1
0.1
0.1
0.1
Returns (%)
ROCE
14.9
16.5
19.6
20.0
Angel ROIC (Pre-tax)
15.8
16.7
20.4
21.5
ROE
12.4
14.4
14.8
14.8
Turnover ratios (x)
Asset Turnover (Gross Block)
3.1
3.4
3.6
3.9
Inventory / Sales (days)
92
80
70
70
Receivables (days)
53
45
43
43
Payables (days)
102
99
53
53
Working capital cycle (ex-cash) (days)
43
27
60
60
Source: Company, Angel Research
August 7, 2019
7
Parag Milk Foods |1QFY2020 Result Update
Research Team Tel: 022 - 39357800
DISCLAIMER
Angel Broking Limited (hereinafter referred to as “Angel”) is a registered Member of National Stock Exchange of India Limited, Bombay
Stock Exchange Limited and Metropolitan Stock Exchange Limited. It is also registered as a Depository Participant with CDSL and
Portfolio Manager and Investment Adviser with SEBI. It also has registration with AMFI as a Mutual Fund Distributor. Angel Broking
Limited is a registered entity with SEBI for Research Analyst in terms of SEBI (Research Analyst) Regulations, 2014 vide registration
number INH000000164. Angel or its associates has not been debarred/ suspended by SEBI or any other regulatory authority for
accessing /dealing in securities Market. Angel or its associates/analyst has not received any compensation / managed or co-managed
public offering of securities of the company covered by Analyst during the past twelve months.
This document is solely for the personal information of the recipient, and must not be singularly used as the basis of any investment
decision. Nothing in this document should be construed as investment or financial advice. Each recipient of this document should
make such investigations as they deem necessary to arrive at an independent evaluation of an investment in the securities of the
companies referred to in this document (including the merits and risks involved), and should consult their own advisors to determine
the merits and risks of such an investment.
Reports based on technical and derivative analysis center on studying charts of a stock's price movement, outstanding positions and
trading volume, as opposed to focusing on a company's fundamentals and, as such, may not match with a report on a company's
fundamentals. Investors are advised to refer the Fundamental and Technical Research Reports available on our website to evaluate the
contrary view, if any
The information in this document has been printed on the basis of publicly available information, internal data and other reliable
sources believed to be true, but we do not represent that it is accurate or complete and it should not be relied on as such, as this
document is for general guidance only. Angel Broking Limited or any of its affiliates/ group companies shall not be in any way
responsible for any loss or damage that may arise to any person from any inadvertent error in the information contained in this report.
Angel Broking Limited has not independently verified all the information contained within this document. Accordingly, we cannot testify,
nor make any representation or warranty, express or implied, to the accuracy, contents or data contained within this document. While
Angel Broking Limited endeavors to update on a reasonable basis the information discussed in this material, there may be regulatory,
compliance, or other reasons that prevent us from doing so.
This document is being supplied to you solely for your information, and its contents, information or data may not be reproduced,
redistributed or passed on, directly or indirectly.
Neither Angel Broking Limited, nor its directors, employees or affiliates shall be liable for any loss or damage that may arise from or in
connection with the use of this information.
Disclosure of Interest Statement
Parag Milk Foods
1. Financial interest of research analyst or Angel or his Associate or his relative
No
2. Ownership of 1% or more of the stock by research analyst or Angel or associates or relatives
No
3. Served as an officer, director or employee of the company covered under Research
No
4. Broking relationship with company covered under Research
No
Ratings (Based on Expected Returns:
Buy (> 15%)
Accumulate (5% to 15%)
Neutral (-5 to 5%)
over 12 months investment period)
Reduce (-5% to -15%)
Sell (< -15%)
August 7, 2019
8